

The chart above is a two-vertical axis chart showing two hypothetical customers’ expected electricity usage profile for 2017 on one axis and the two different 2017 forward curves at different times during 2016 on the other. What this exercise is endeavoring to accomplish is to show that every customer’s load profile is different and therefore subject to different risk parameters as a forward curve made up of 12 discrete monthly prices is always shifting.
While weather certainly has a large impact on all commercial customers’ electricity usage monthly profiles, it is only one of many elements that determine the profile. The particular use for a building can have a giant impact on a client’s profile. For example, a cold storage facility will have outsized usage during the summer months while a large college with limited summer enrollment and electric heating will have larger usage and exposure during the winter months.
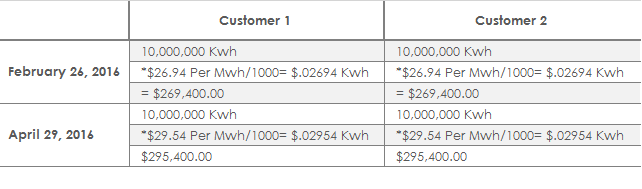
While most customers in electricity choice states are interested in 12, 18, 24, and 36-month prices and with the result of whether it saves them money, we are trying to educate customers that the same price means different things to different customers based on their load profiles. In the chart above, these two customers use about the same amount of electricity (+10 GWhs) on an annual basis, but they use different amounts at different times. Customer 1 is what we classify as a winter peaker and customer 2 is a summer peaker. The price (when taking the sum of the 12-monthly prices and dividing by 12) for the 2017 forward strip was $26.94 per MWh of curve on February 6, 2017 and $29.54 per MWh on April 29th. A simple approach would be to figure out the impact by multiplying a customer’s load by the change in price. Since each customer is approximately 10,000,000 kWhs, the impact should be the same. In this case, each customer is going to be paying $26,000.00 more annually due to the $2.60 Per MWh price rise from Feb 26, 2016 until April 29, 2016.
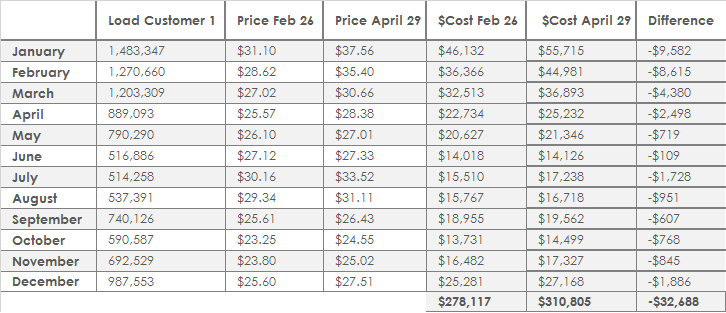
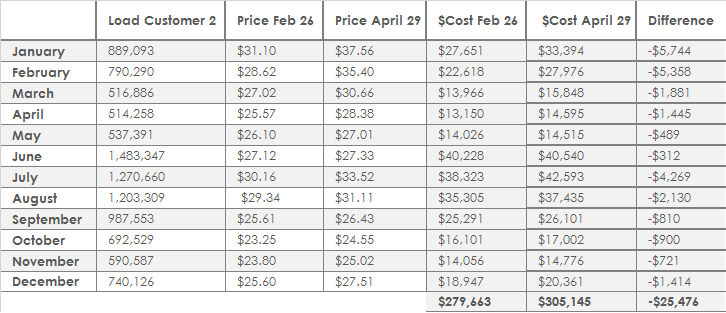
However, this is an incorrect approach. We must look at each monthly load and each monthly price to get a more accurate mark-to-market impact due to the price change. Using the chart above we see that customer 1 has a much larger exposure to the winter months and that customer 2 has an inverse exposure profile with much more of the risk in the summer. When we look at the exposures by month for load and price the results are quite a bit different.The P&L change for Winter Peaking Customer 1 is a negative $32.7K while the change for Summer Peaking Customer 2 is only negative $25.5K.
This example illustrates that it is important that clients understand their load profiles and have access to monthly forward prices to be able to see their risk through time in terms of both volume and price.
Sources – CME Group