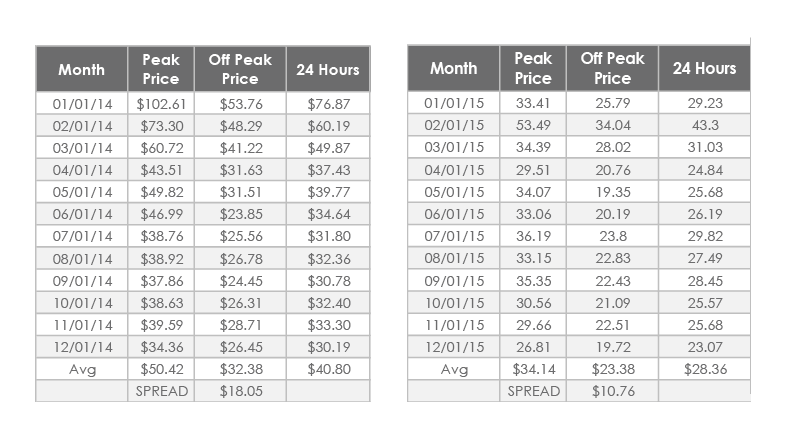
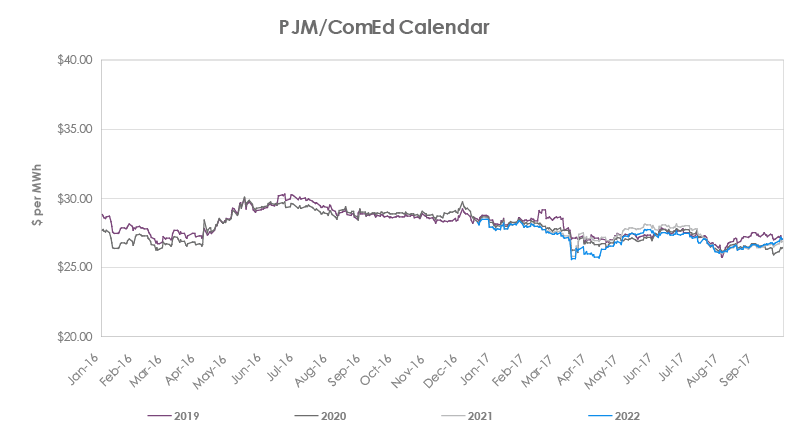
An examination of Chart 1(See page 4) shows that the market is not currently anticipating higher prices for further out curves for any reason as Around the Clock (ATC) prices for the 2018, 2019, 2020, and 2021 forward curves have been declining and the entire curve is in backwardation (prices lower the further out the curve). This could be the result of many factors, so we want to look further to see if the relationship between Peak and Off-Peak have been changing. We need to set a benchmark, so we have placed the historical monthly results of peak, off-peak, and ATC from Jan 2014 through September 2017 (See below). We can see that, with the exception of 2014 (Polar Vortex Outlier), there has been a pretty consistent approximate $10.50 spread between Peak and Off-Peak pricing. It would be expected that the 2014 spread would be much higher because of the scarcity pricing experienced during the Polar Vortex.