For PJM customers, Demand Response is usually directly related to the capacity payments that customers pay for having enough resources on the grid. It is important to note that the PJM capacity market and the Demand Response program changed in 2015 in response to the Polar Vortex of the winter of 2014 where the system was really tested and spot prices traded at historically high levels. The aim of the changes is to ensure that resources pledging capacity to the system perform when called upon, which has led to generally higher capacity prices in PJM and, more specifically, in the ComEd region of PJM. A review of the chart above shows PJM/ComEd capacity price through May 2021 (every April there is a capacity auction that determines the capacity price three years forward to allow for planning and to provide price signals to potential resources). The capacity price ($215 Per MW DAY) for 2018-19 is up 40% from the 2017-18 price and has more than doubled from the 2016-17 price. Customers unfortunately know that these capacity price increases have had a noticeably negative impact on their final delivered electricity price offered for these time frames. We estimate that capacity costs for 2018-19 will amount to 1.5 to 3.75 cents Per kWh depending on the customer and their load profile and load factor.
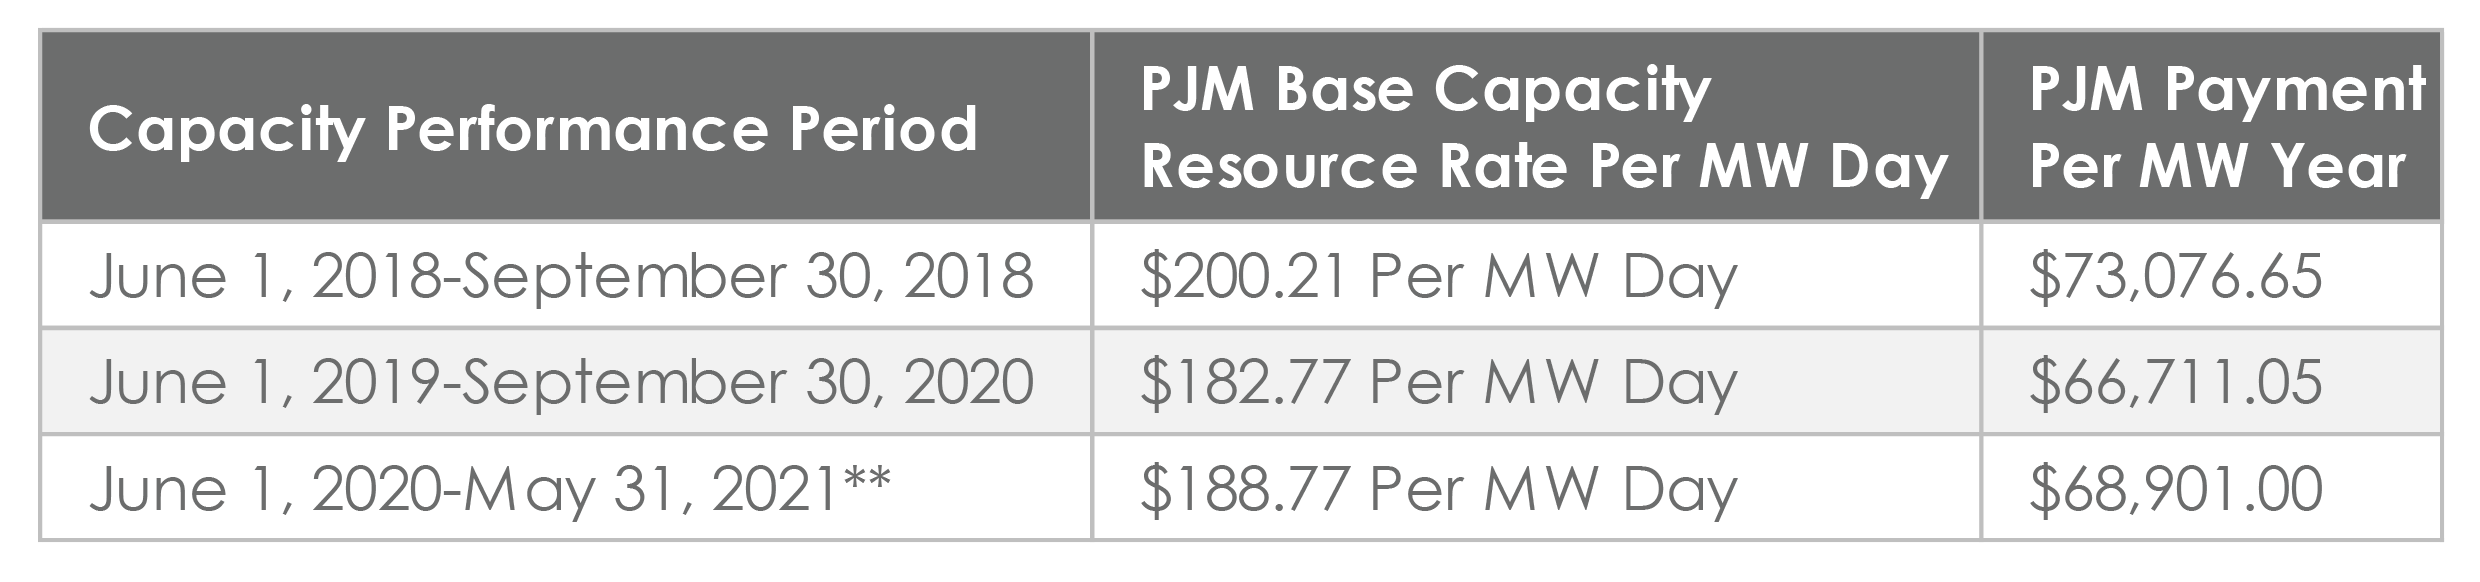
Participants in the Demand Response programs recoup some of their capacity costs by being paid to reduce their capacity at certain times. There are generally two types of Demand Response: Price Demand Response and Capacity Demand Response (with Capacity Demand Response being the more prevalent type). A Price Demand Response participant sets a PJM wholesale price where they will reduce their demand when the wholesale price reaches that level and be compensated by PJM for doing so. A capacity Demand Response customer will be compensated with a “capacity payment” for pledging to reduce their demand by a predetermined amount when called upon by the PJM Pool to do so. This payment is not the exact same price that a customer pays for capacity, but it is close. The table below shows what the payments per MW year will be for the next three years.