
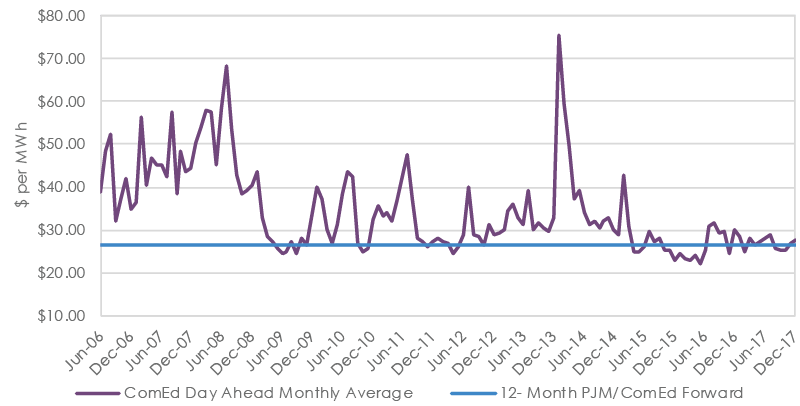
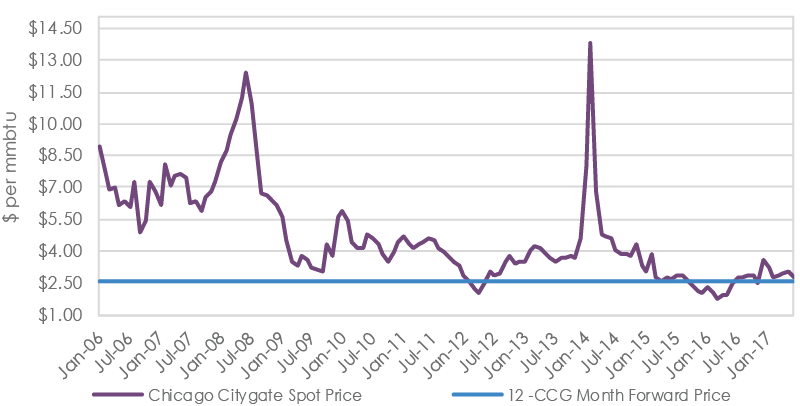
A review of Charts 1 and 2 indicate that we have generally been in a bear market for electricity and natural gas for the past several years, with significant lows made in the 1st quarter of 2016. We have highlighted many of the bearish price drivers in these pages over the last few years. They include the horizontal fracturing production boom for natural gas since about 2010 that has completely transformed the United States from being a net natural gas importer to being an exporter in a few short years. This has allowed for cheaper electricity prices derived from natural gas electricity generators. We have seen vast improvements in energy efficiency, which has dampened overall energy demand. We have observed the unprecedented growth of renewable energy, which allows for cheap power at certain times since there are no fuel costs for wind and solar, and, in general, solar and wind generators run when the sun is shining or wind is blowing. We have observed the emergence of battery storage technologies that have allowed these same renewable technologies to be more efficient by providing ancillary services to the grid. These have all contributed to lower prices.
Unfortunately, not all of these benefits have shown up in a customer’s overall energy price because while commodity costs have fallen, non-commodity costs have risen and now account for an everincreasing portion of a customer’s invoice. A good example is the PJM/ComEd area where electricity prices have been low but capacity costs (see Chart 3) and distribution costs have risen. The 2016 Illinois Energy jobs act is another a good example. Among other things, this bill guaranteed subsidized payments to the owners of nuclear electricity generating plants in Illinois (New York had similar legislation). While this shows up in lower spot prices, the customer still pays for this as a line item (zero emission credit charge) on their distribution bill.