
It is a well-documented story regarding the abundance of natural gas now being produced domestically due to horizontal fracturing. It has changed the entire landscape of the market.
With a few exceptions (the polar vortex conditions of 2014 and 2018 and some significant dislocations in California come to mind), prices have remained at very low levels for the last few years. Parallel to the growth of production, there has been a worldwide demand boom as well as significant infrastructure built here in the United States that now allows for the export of natural gas in the form of Liquefied Natural Gas (LNG). We want to take time this month to examine both the supply and demand side of these markets to see if we can gauge a direction to prices over the coming years.
Through the summer, the natural gas market was quite weak from a price perspective. Since this is more of a macro discussion, we are going to focus on natural gas from the perspective of the Henry Hub market since this continues to be the liquidity hub for natural gas in the United States. Additionally, with the emergence of Liquefied Natural Gas as a “global” fuel, Henry Hub prices are of global importance. We are also trying look at the market from a longer term perspective.
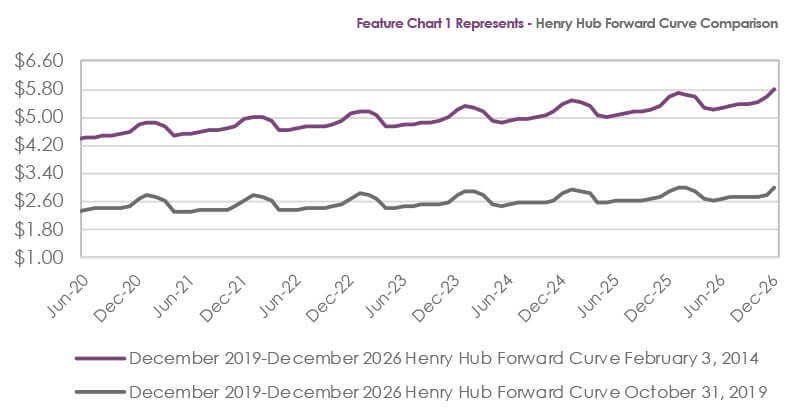
Chart 1 shows a comparison of Henry Hub forward curves for the period December 2019 – December 2026 with one snapshot taken on February 3, 2014 after the 2014 polar vortex and one compiled on October 31, 2019. We are a data-driven energy consultant, and we believe this chart provides some important information. Not only has the nominal price of that entire strip of prices declined 47.58% over the time frame referenced, the shape of the curves has flattened significantly, with winter prices now much less peaked than in 2014. This is clearly good for consumers and not so good for producers.
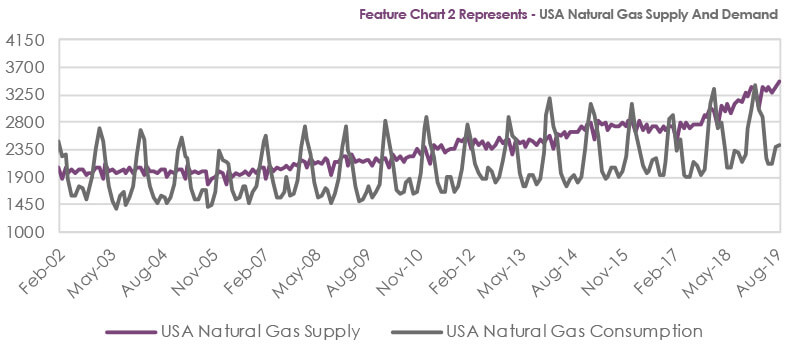
Chart 2 shows USA monthly supply and demand numbers as provided by the Energy Information Administration (EIA). The demand numbers are rising (in a staggered fashion due to the seasonality of demand) but not as quickly as the supply numbers (which are consistent by month). So, when looking at the two charts, the supply-demand chart can easily explain the move in the forward curves. Going forward, the question is whether this dynamic continues or whether something will change in the supply-demand dynamic and what should consumers be doing regarding their purchasing strategies.
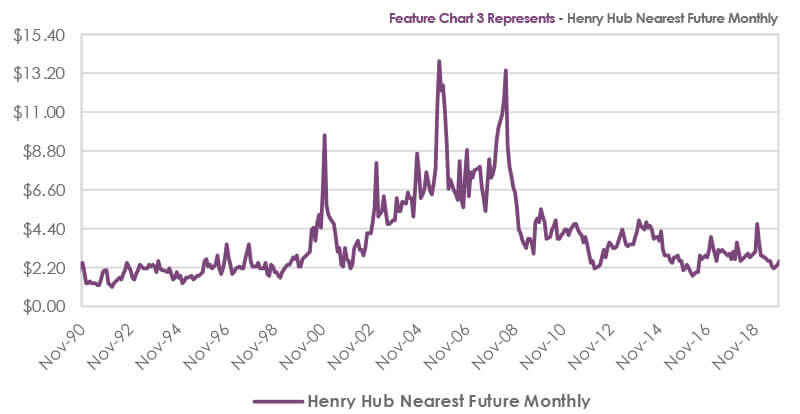
One of the important concepts we try to convey to clients is that the most important thing that can be done is to manage their upside price risk. A look at a monthly Henry Hub nearest futures chart (Chart 3 above) shows that over the past 29 years there have been plenty of upside price moves in the natural gas market and extended periods of low prices. Market drivers are constantly changing, and the horizontal fracturing phenomenon has certainly been the main catalyst for this recent period of very low prices. It is important to note that the supply of natural gas has increased globally, primarily in both Qatar and Australia. That said, we have also seen international demand increase steadily, especially in Asia. So, with all these conflicting issues, what are we currently advising clients to do?
The market is the market, and it is currently offering very attractive values based on historical prices. While we think the demand side of the equation will continue to grow unabated because the world needs the most efficient fossil fuel to provide a bridge to a lower carbon world, we are not as sanguine about the supply side as we see possible risks on the horizon. Horizontal fracturing presents some risks just due to the environmental concerns. Additionally, while we are politically agnostic, it must be acknowledged that a change in the government to a different political party during the 2020 national election could impact natural gas production if regulations are tightened.
We continue to believe that natural gas consumers should be locking in fixed prices for a majority portion of their future obligations since prices are this low. We understand that prices can go lower, but we also still believe in energy price reversion and understand that markets change quickly and that supply disruptions can really cause prices to move sharply higher when they do occur.
Analyst – David Mousseau
Source – Reuters, Energy Information Administration (EIA), and Bloomberg