
Each electricity and natural gas customer is different since they each have varied usage profiles, consuming different quantities of energy at different times. These signature load curves make each customer’s risk profile unique in terms of its exposure to future pricing. For example, many natural gas users use much more gas for heating during the winter season while other industrial users who use natural gas in an industrial process will have a much more consistent usage profile. This can be said about a commercial real estate building that has high summer electricity cooling load versus a cold storage facility that has a constant, consistent load.
We have often discussed that forward curves for electricity and natural gas are just the future expectations of spot pricing. They are a snapshot in time, and the actual results of spot pricing implied by any forward curve at a point in time are usually not the same. That said, forward curves tend to evolve based on ongoing shifts in spot pricing, which has impacts for consumers who use different amounts of energy at different times. A review of the charts for PJM/ComEd that are displayed reveals these differences. We have taken snapshots of forward curves just prior to the start of each year. By overlaying the actual delivered spot price on the same chart, we can see that forward prices are not always the best predictor of spot prices. We can also see that spot prices often influence ongoing forward curves.
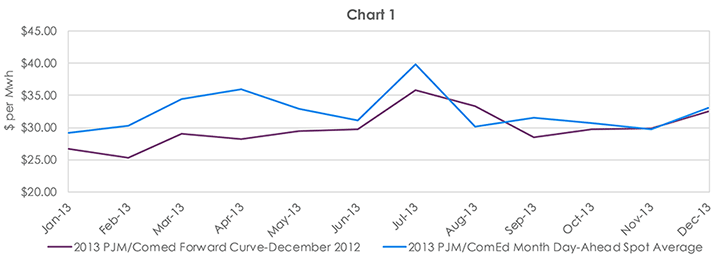
Without being too detailed and discussing too much price history, the PJM/ComEd area has always been known as a summer peaking market, which means that aggregate load in the PJM/ComEd zone has almost always been higher in the summer season and the forward and actual spot prices have usually been higher in the summer than other months. A look at the 2013 Forward curve (Chart 1) observed in December 2012 shows that the forward curve expected higher prices in the summer than the winter and fairly flat prices in the shoulder months.