

As we enter a new year we want to review 2014, a volatile year for energy prices. We will also highlight what the current electricity forward curve for PJM/ComEd looks like when compared to historical averages.
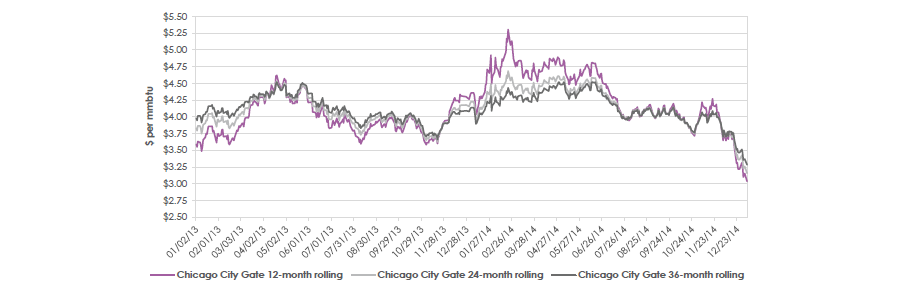
Though natural gas forward strip prices were lower year on year, a review of the daily moves throughout the year of natural gas and electricity forward strips for 12, 24 and 36-months shows a great deal of volatility. The Chicago City Gate 12, 24 and 36 month strips started 2014 at $4.26, $4.16 and $4.08 per mmbtu respectively and showed year on year declines of 27.23%, 22.36% and 17.89% as the 12-month strip closed 2014 at $3.10 per mmbtu, the 24-month strip at $3.23 per mmbtu and the 36-month strip at $3.35 per mmbtu. The above chart shows that prior to turning down sharply in the last month, natural gas had strong rallies during the year with the largest being the 31.51% rally in the Chicago City Gate 12 month strip that was seen from January 9th to Feb 21st, where the price increased from $4.03 per mmbtu to $5.30 per mmbtu when fears of low natural gas storage levels gripped the market.
Electricity had less volatility than the natural gas market. The year on year change for the PJM/ComEd 12, 24 and 36-month forwards was mixed. The 12-month forward had a decline of 2.4% and finished 2014 at $30.45 per Mwh. The 24-month forward increased 2.07% to $31.10 per Mwh while the 36-month forward increased 4.47% to $31.56 per Mwh. The power market did have significant rallies during the year with the largest being concurrent with the aforementioned natural gas rally from January 9th to February 21st. During this time frame the 12-month PJM/ComEd forward rose 30.42% from $30.84 per Mwh to $40.22 per Mwh. Much of this move can be explained by the very high spot electricity prices experienced during the polar vortex.