
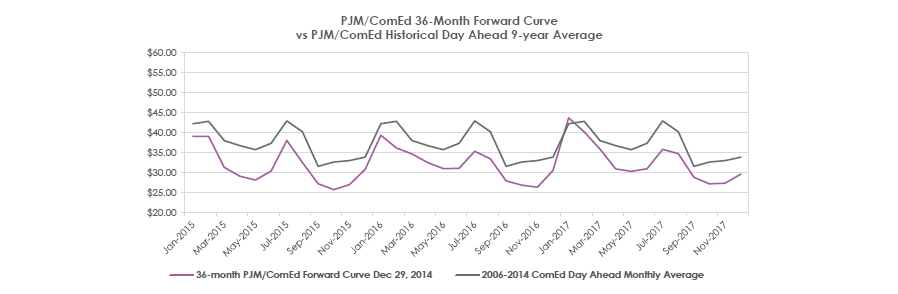
We have entered 2015 with significant downward deflationary momentum to all energy prices being led by the collapse in crude oil prices. Most energy prices have substitution and energy equivalent relationships but these relationships do change. At one point in time crude oil did have a large direct influence on electricity prices but now its impact is confined to crude oil’s relationship to natural gas which is now the largest influence on electricity prices. It is difficult to gauge just how much longer this cycle of low prices will last but the charts in this report highlight that markets do move back and forth and that these low prices could provide an opportunity to procure supply at relatively attractive rates. The above electricity chart shows the 36-month forward curve against the monthly Day-Ahead average (spot price) for the PJM/ComEd area. A forward curve is the expectation of spot prices over any particular time frame (in this case over 36 months) and the monthly day ahead average was compiled from nine years (2006-2014) of day-ahead data for PJM/ComEd. What is important for this nine year period is that it is comprised of periods of economic expansion (2006-2008), economic contraction (2008-2009), slow recovery and very low natural gas prices (2010-2012) and better economic growth (2013-2014). Currently (Dec 29) the 36-month forward curve is generally priced under the historical averages by approximately 13.75% depending on the month or year. This does not mean that prices cannot go lower but only that the current forward price is discounted from the nine-year historical average, offering potential savings to the buyer against historical prices. We will update the above chart periodically in the coming year.