

With a third of calendar year 2018 now completed, here is a quick review of the energy markets in the Midwest. While price movement in the energy markets here in Illinois in the first third of the year has been small, there have been some developments that are not completely obvious and are worthy of detailed discussion.
To start the year, there was some very cold weather in January. While there was a lift in spot pricing for electricity and natural gas during that month, it certainly could not be characterized as scarcity pricing (though there were some extremely high prices in other parts of the Eastern InterConnect).
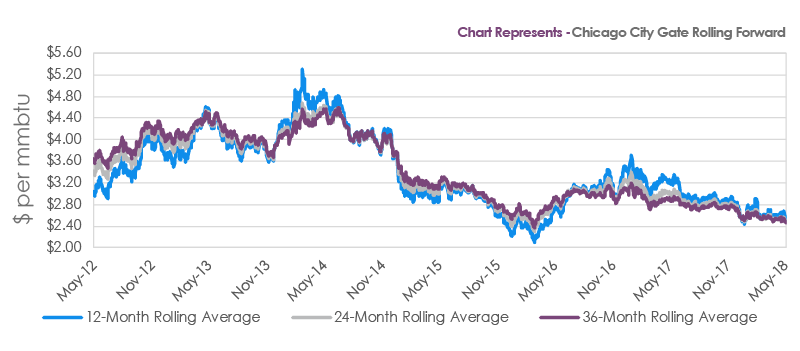
For the first four months of the year, monthly day-ahead spot average natural gas prices delivered to Chicago City Gate were $2.90 per MMBtu, 2.36% lower than during the same period of 2017. This compares to practically zero year-on-year change in the Henry Hub (liquidity benchmark) monthly day-ahead spot average of $3.02 per MMBtu for the same period. This is evidence of the continued weakening in the Chicago City Gate-Henry Hub basis that we have written about previously. Regarding forward pricing for natural gas, we have seen these markets also retreat, with Chicago forward prices again softer than Henry Hub. The Chicago City Gate 12, 24 and 36-month rolling forward prices have declined 5.60%, 6.08%, and 5.95%, respectively, since 12/29/2017 and finished April at $2.55, $2.48, and $2.48 per MMBtu. Henry Hub 12, 24, and 36-month rolling forward prices experienced more muted declines of 1.12%, 2.50%, and 3.04% to $2.81, $2.76, and $2.74 per MMBtu. Negative basis levels of 25-30 cents should be particularly attractive to Chicago Natural Gas consumers. Clearly, the market in Chicago has changed with the addition of natural gas pipeline capacity and the abundance of shale gas in Ohio and Pennsylvania. That said, this news is reflected in current prices, and the low forward Chicago prices really do offer historical value in a market that can change suddenly.
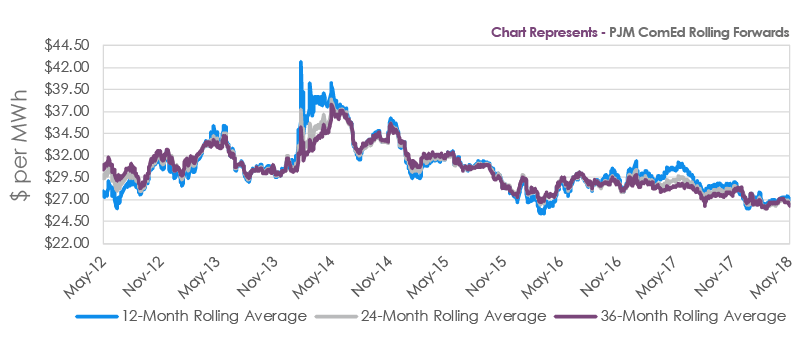
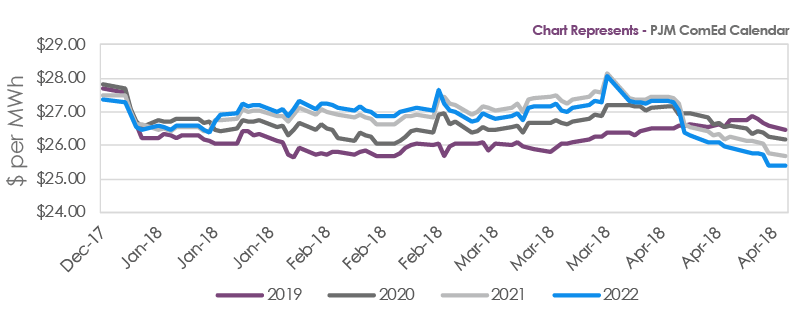
Electricity prices in Illinois have followed similar small movement patterns in 2018 but were stronger than natural gas until the 2nd half of April when longer-dated prices experienced a significant sell-off. Monthly Day-ahead Average prices for PJM/ComEd have averaged $28.10 per MWh in 2018, 4.03% higher than the $27.01 Per MWh price for the same period in 2017. Forward pricing has declined during 2018 with the 12, 24, and 36-month PJM/ComEd rolling forwards down 1.78%, 3.83%, and 4.71%, respectively, to $27.07, $26.64, and $26.41 per MWh. What these price moves do not show is the real weakness further out the curve. Looking at the yearly price changes for the further-dated calendar prices, further price erosion is evident. Calendar strip prices for 2019, 2020, 2021, and 2022 have declined 4.77%, 5.95%, 6.70%, and 7.14%, respectively, and ended April at $26.46, $26.15, $25.67, and $25.40 per MWh. These are significant price moves given the low relative price levels at which we started the year. Even more significantly, most of these yearly price declines occurred in the last half of April.
These moves in further-dated PJM/ComEd were/are a bit of a mystery as there did not appear to be any major “macro” catalyst for these moves, and no other region in the Eastern Interconnect experienced such moves. Our research has led us to believe that this move was “micro” in nature and could be a temporary move that provides an opportunity to discerning electricity customers.
On April 13th, the Illinois Power Agency released the results of its Procurement Auction. This auction procures power from generators on behalf of the Illinois utilities to serve default load (customers who have not switched to alternative suppliers). They procure load in incremental amounts to balance the buying risk. The results showed very low prices for the procurement years of June 2019-May 2020 and June 2020 -May 2021. The average price for 2019-20 was $26.73 per MWh, and for 2020-21 it was $27.00 per MWh. These prices were lower than what the wholesale market was trading at when the results were announced. It is our belief that wholesale traders who usually understand the dynamics of this whole process were caught on the wrong side and spent the rest of the month liquidating positions, causing the sudden drop in the wholesale forward prices.
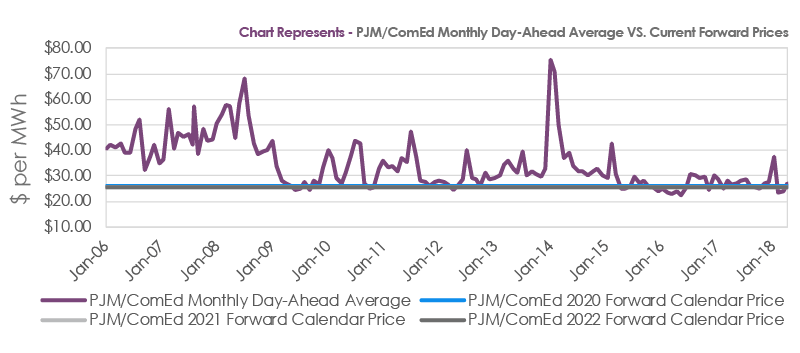
What does this mean for ComEd electricity consumers? This event is providing a very good opportunity to lock in electricity supply at very good prices for long periods of time. Could already record low prices go a little bit lower? It is certainly possible, but electricity markets are characterized by upside event risk that is difficult to predict. The average PJM/ComEd Day-Ahead price (the price forward prices are predicting) since joining PJM in 2006 has been $34.31 per MWh. This means that the current market prices of $26.15, $25.67, and $25.40 per MWh for 2020, 2021, and 2022 are 23.78%, 25.18%, and 25.97% below the average price for the last 12 years. Again, this is a good opportunity for ComEd electricity consumers to lock in their energy prices for two to three years and understand that while prices could slip lower briefly, they are eliminating upside risk and providing commodity budget certainty for the next two to three years.
Sources: Direct Energy, Reuters, Rover Pipeline