

With a third of calendar year 2019 now completed, here is a quick review of the energy markets in the Midwest YTD and some thoughts on future price movement. The natural gas and the electricity markets in Illinois can be characterized as boring as markets really have not moved much since December 31, 2018. We did have some cold weather in January and March, but the markets absorbed the colder conditions without incident or large price spikes. Spot prices for natural gas and electricity have been trending lower than in recent history. Forward prices have remained firm, though they certainly cannot be characterized as strong.
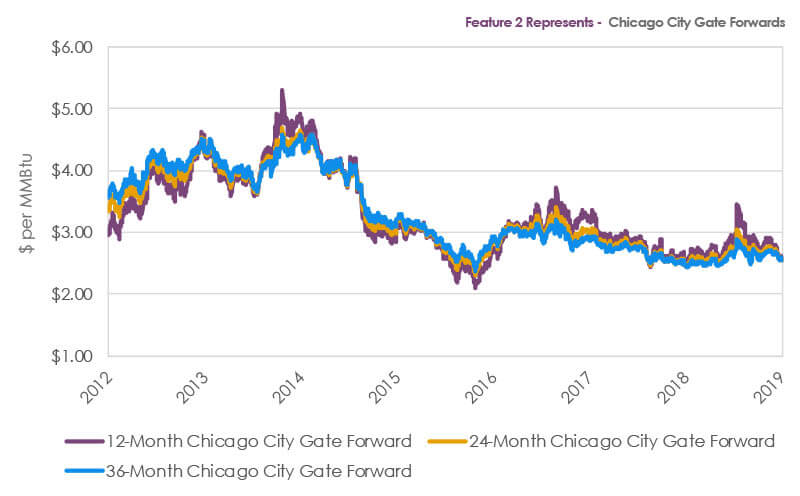
For the first four months of the year, daily average prices delivered to Chicago City Gate were $2.88 per MMBtu, just 1.03% lower than the 2018 same period price of $2.91 per MMBtu. This compares to a Henry Hub daily average price of $2.83 per MMBtu for the first four months of 2019, 6.29% lower than the $3.02 per MMBtu price observed in the same months in 2018. It is important to note that this reflects a generally stronger Chicago City Gate basis as it appears that the additional pipeline capacity installed in recent years to bring natural gas into the Chicago City Gate market is being absorbed well. In the forward markets, price changes since Dec 31, 2018 have been mixed and tepid. The Chicago City Gate 12, 24, and 36-month rolling forward prices changed by -2.74%, -.70%, and +.78%, respectively, since December 31, 2018 and finished April at $2.59, $2.58, and $2.58 per MMBtu, respectively, showing a slight flattening of the curve. Henry Hub 12, 24, and 36-month rolling forward prices exhibited similar movement, with price changes of -3.03%, -1.02%, and unchanged, respectively, with closing April prices of $2.72, $2.70, and $2.69 per MMBtu. It is important to note that forward Chicago basis has strengthened from -25-30 cents per MMBtu last April 30th for the same forward time periods to -10-12 cents per MMBtu for April 2019. It is difficult to determine whether the CCG basis will continue to strengthen, but one indicator may be that the Chicago cash basis has averaged -9 cents per MMBtu from May 1, 2018 thru April 30, 2019. This would suggest that for now, the Chicago City Gate basis is at fair value.
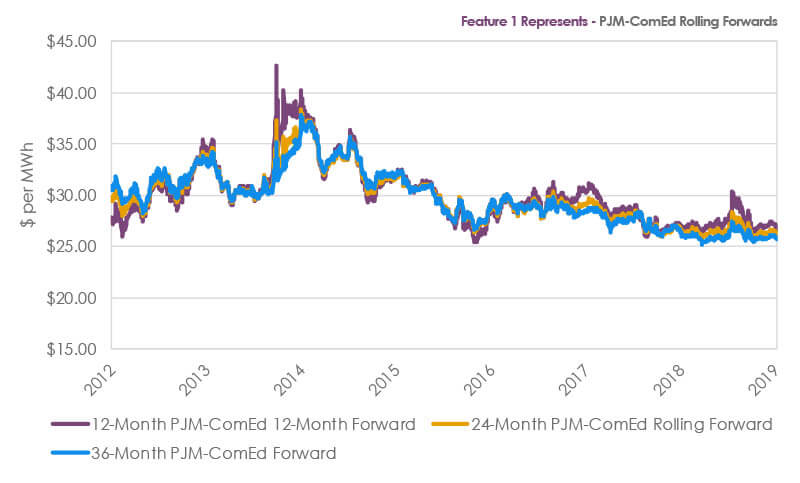
Electricity has also been quiet YTD in 2019. Day-ahead prices have been weak. The Day-ahead average price for the first four months of 2019 has been $25.93 per MWh, 7.72% lower than the average day-ahead price of $28.10 per MWh observed for the same period in 2018. Forward pricing has been mixed so far in 2019 with the 12, 24, and 36-month PJM/ComEd rolling forwards -2.16%, +.68%, and +.66% respectively to $27.22, $26.52, and $26.03 per MWh. While the price movements have been small, the curves have become less backwardated, though prices are still lower the further one goes out on the curve. One large change from April 2018 is that in April 2019 the cash prices are trading below forward prices as opposed to a year ago when cash prices were trading higher than forward prices. Everything being equal, it is better for the electricity consumers to be buying forward under the prevailing spot prices.
Given all of this information, what do we think about future price moves for the balance of 2019 and beyond? In the past, we have recommended that customers lock in large percentages of their future gas and electricity load obligations by fixing their prices for as long a duration as possible and with which they are comfortable. This has been a pretty good strategy since the backwardated forward curves dictated such an approach. Our goal as risk managers is to try and balance the elimination of upside price risk against possible gains from lower prices. Prices for both electricity and natural gas have generally been low here in the Midwest for some time, and on a relative basis, they still are. For natural gas here in the Midwest, we have seen much less scarcity pricing on cold days the last few years because of the improved pipeline infrastructure alluded to earlier. We do think the improved basis numbers in the Chicago City-Henry Hub differential indicates that tightness in Chicago City Gate pricing could return at some point. We continue to think that natural gas prices will rise over the next few years, and we see the quiet removal of the backwardation in the forward curves as an indicator of that. Our high-level fundamental view of natural gas is that is becoming a global market and we see the much better (NG still a fossil fuel) environmental attributes as fueling global demand as the world moves from fossil fuels to cleaner energy. Of course, that type of transition would lead to less demand at some point, but that is for another day.
We are somewhat less positive about electricity here in the Midwest. The proliferation of subsidized power (both nuclear and solar) here in Illinois has kept a lid on spot prices, and with spot prices now trading below forward prices, we need to pay attention to that. That said, the fact that forward prices have risen this year could be indicative that the market does not see all the subsidies lasting. For now, we still think it makes sense for customers to fix a good portion of their obligations but perhaps for not as long a time frame until more indicators reveal themselves.
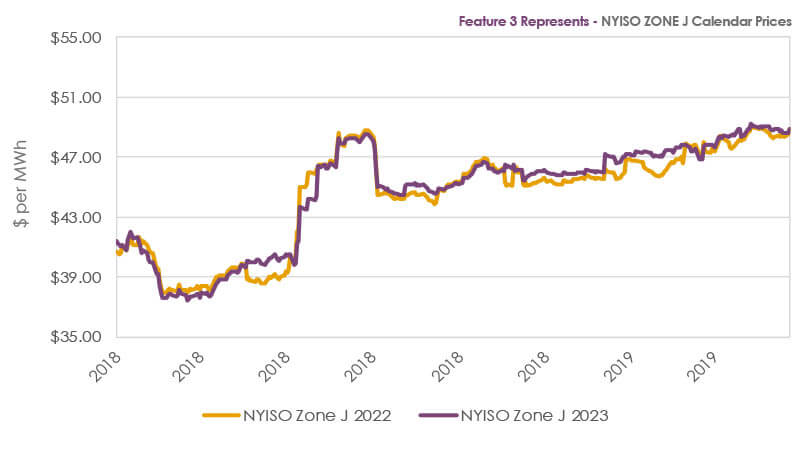
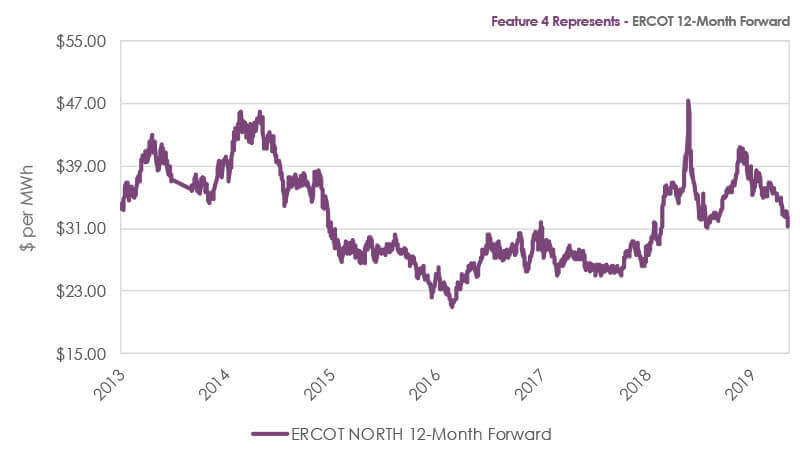
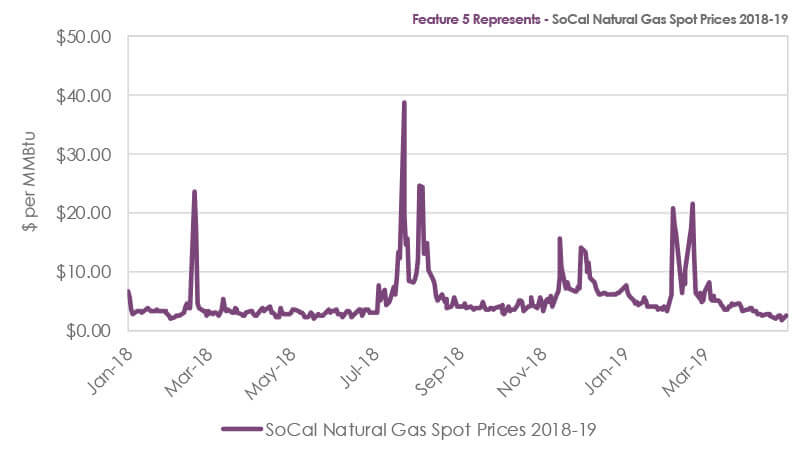
We have a central theme here at Alfa Energy, and it is that we believe that energy markets are event-driven markets and they have tremendous upside price risk. While this article is about Midwest energy prices, readers of this newsletter know that we work with customers in many states. Many customers in other regions have seen high prices due to events that have impacted the energy markets. A few examples would be the introduction of carbon pricing in NYISO, which has caused some forward prices to go up by 30% in one year; the nearly 80% price advance in the ERCOT 12-month forward in early 2018 due to a lower revision in ERCOT’s generating reserve margin; and the explosive natural gas prices in Southern California due to large weather variation in both the summer and winter. These examples highlight that the time to be most vigilant regarding energy prices is when they are low because prices can change very quickly.
Sources: PJM, CME, and Reuters