
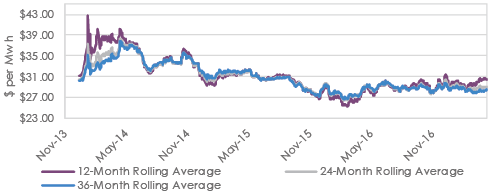
One major takeaway from the first four months is the fact that the energy forward markets continue to be in backwardation (prices lower the further out the curve). The market continues to believe in plentiful natural gas supply and continued efficiency and demandside management gains on the power side. This has been occurring in what can generally be characterized as an overall bear market for both electricity and natural prices since the Polar Vortex rally in the first quarter of 2014. It should be noted that we did make lows for both commodities in the 1st quarter of 2016. For a point of reference (please see chart 1 and chart 2), the 12, 24, and 36-month forward curves for electricity finished April down 28.64%, 21.79%, and 18.94%, respectively from their respective 2014 highs. CCG 12, 24 and 36-month are down an even more noticeable 40.9%, 35.47% and 36.33%, from their 1st quarter 2014 highs.
When attempting to discern what exactly this means going forward regarding future pricing, we can only use the current and historical information available to us. A close look at charts 1 and 2 reveal that both the gas and electricity markets have gone from backwardation to contango (prices higher further out the curve) to backwardation over the last 40 months. This is very important because customers are usually analyzing 12, 18, 24, and 36-month fixed price quotes, and both the current formation of the forward curve and expectations of future movement influence the decision-making process.